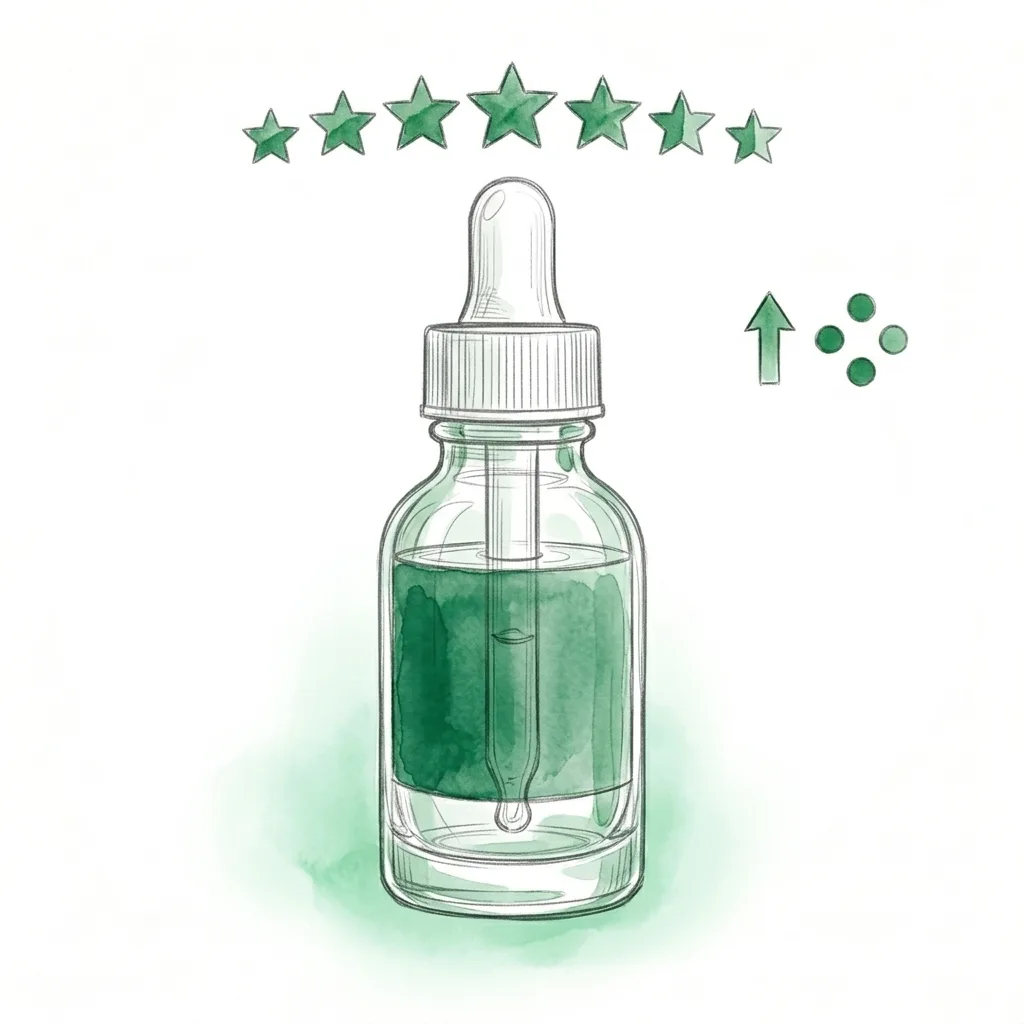
Skincare+33%add-to-cart lift
DermaClearSwapped ingredient-first copy for outcome-focused headlines. Results in 12 days.
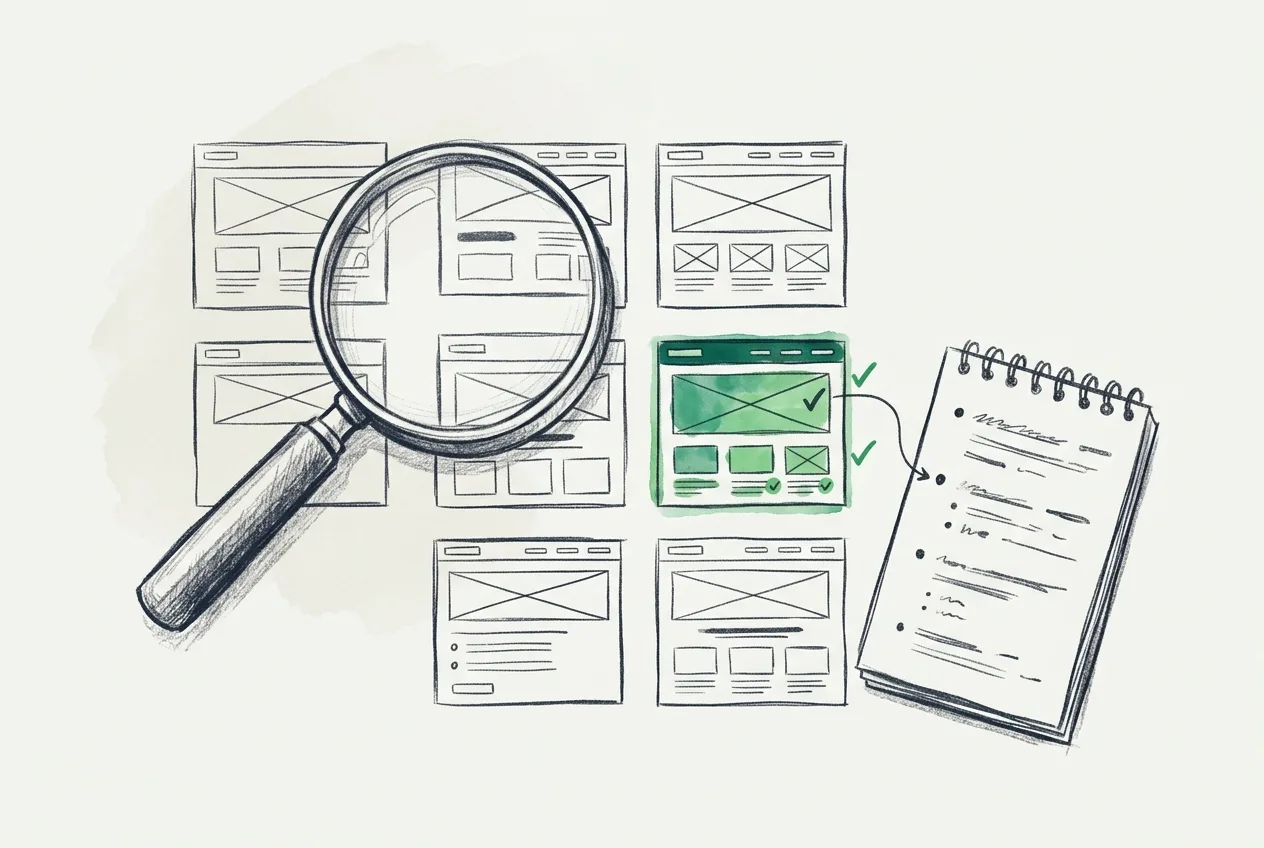
Read case studyA research-first framework for finding high-impact tests.
Stop guessing what to test. Use competitor research to find specific, evidence-based test ideas for your website.
Grona Team
Published 3 Dec 2025
Every "what to A/B test" article gives you the same list: your headline, your CTA button, your hero image, your form fields.
That is like a doctor saying "eat healthy and exercise." Technically correct, completely unhelpful.
The real question is not what to test. It is how to find what is specifically wrong with YOUR site. And the fastest way to find that is to look at what your competitors are doing differently.
This article gives you a four-step framework for turning competitor research into specific, evidence-based test ideas. No generic checklists. No "test your button color" advice.
"Test your button color" is the most cited A/B testing advice on the internet. It is also the lowest-impact test you can run. Color changes rarely move conversion rates in any meaningful way.
Generic advice ignores context. Your industry, your audience, your specific conversion bottleneck, and your current baseline all determine what will actually move the needle.
The highest-impact tests come from spotting gaps between your site and what works in your category. If every competitor in your space leads with outcome-focused headlines and you lead with feature descriptions, that gap is a signal worth testing.
You need data, not a checklist. You need to understand your competitive landscape before you decide what to change.
The framework: instead of starting with a generic list, start with research. Look at what is working for others in your market. Identify where you diverge. Test the divergence.
Four steps. Each one builds on the last. By the end, you will have a prioritized list of test ideas grounded in real competitive data, not guesswork.
Open Google Analytics (or whatever analytics tool you use). Navigate to your top pages by traffic. Look for pages with high traffic and below-average conversion rate. Those are your testing targets.
Do not guess. Let the data point you to the problem. A page with 10,000 monthly visitors and a 1.2% conversion rate when your site average is 2.5% is screaming for attention.
If you do not have analytics set up, start with your homepage or your highest-traffic landing page. Those pages affect the most visitors.
Look at competitors in your space. Not just direct competitors, but anyone competing for the same customer's attention and budget. For the same type of page (homepage, product page, pricing page), analyze each competitor and note:
You are looking for patterns, not copying any single competitor. If 8 out of 10 competitors do something differently from you, that is a signal.
With Grona, you can ask the AI to analyze competitor pages through chat and get structured comparisons in minutes. But you can also do this manually with a spreadsheet. The method matters more than the tool.
Compare your page against the competitor patterns you documented. Where do you diverge from the category norm?
Common gaps that surface:
Each gap is a test hypothesis: "If I change [element] from [current approach] to [competitor pattern], conversion will improve because [the pattern suggests this is what our shared audience responds to]."
Not every gap is worth testing. Some are intentional brand choices. But gaps you cannot explain are gaps worth investigating.
Not all tests are equal. You want to start with the test most likely to produce a measurable result in the least amount of time. Rank your test ideas by three dimensions:
A useful scoring model: ICE (Impact x Confidence x Ease, each rated 1 to 10). Multiply the three scores. Test the highest-scoring idea first.
| Test Idea | Impact | Confidence | Ease | Score |
|---|---|---|---|---|
| Rewrite headline to outcomes | 9 | 6 | 10 | 540 |
| Move reviews above fold | 8 | 7 | 9 | 504 |
| Reduce form to 5 fields | 7 | 8 | 8 | 448 |
Multiply I x C x E. Test the highest score first.
Start with the high-traffic, big-gap, easy-to-implement tests. Save the complex ones for when you have momentum.
These are not guesses. Each pattern comes from documented tests with specific, measurable results.
Customers buy outcomes, not ingredients. Feature copy makes them do the translation work. Outcome copy speaks directly to what they want.
Case Study: DermaClear
Result: up to +33% add-to-cart in 12 days
How to spot this on your site
Your headline mentions ingredients, specs, technical features, or product capabilities. Competitors in your space mention results, outcomes, transformations, or the customer's end state.
You now have an underperforming page, competitor intelligence, identified gaps, and a prioritized list of test ideas. Here is your next step.
Pick the number one test from your prioritized list. Write a clear hypothesis: "Changing [element] from [current] to [variation] will improve [metric] because [reason from research]."
Implement it. Test it. Measure it. Learn from it. Repeat.
The first test is the hardest. Not because it is complex, but because it requires you to move from planning to doing. After that first test, you will have data, momentum, and a growing understanding of what your audience responds to.
If you want to go from hypothesis to live test in one afternoon, Grona lets you describe changes in chat, preview them on your actual site, and launch with one click.
Most teams that start testing never stop. Once you see a 15% lift from a headline change you made in an afternoon, the ROI of testing becomes impossible to ignore.
The best test idea is not on a generic checklist. It is hiding in the gap between your site and what works in your market.
The best test idea is not on a checklist. It is hiding in your competitor's website. You now have the framework. The next step is to run the research and launch your first test.
Proof it works
Real businesses. Real metrics. All tested with Grona.
Swapped ingredient-first copy for outcome-focused headlines. Results in 12 days.
Read case study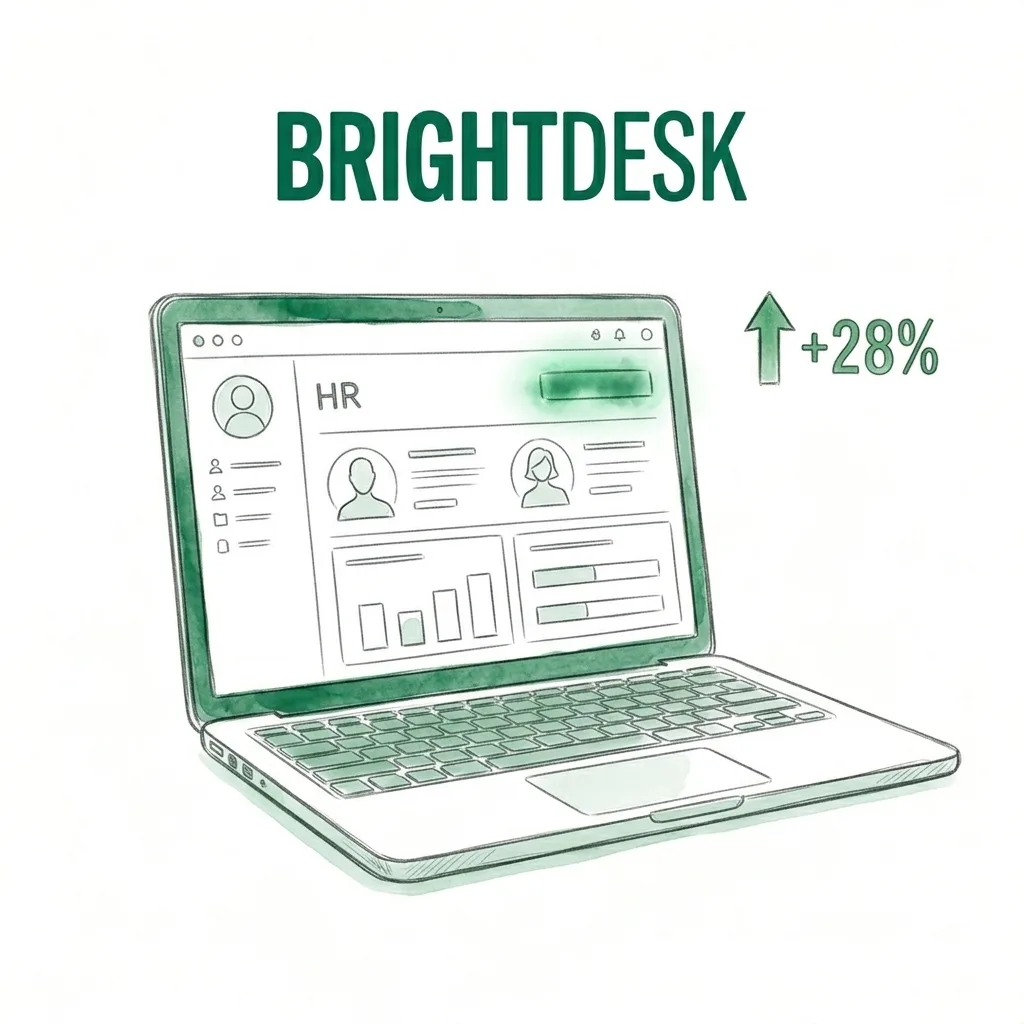
Changed 'Get Started' to 'Talk to an HR Expert' and cut form fields from 9 to 5. 14 days.
Read case study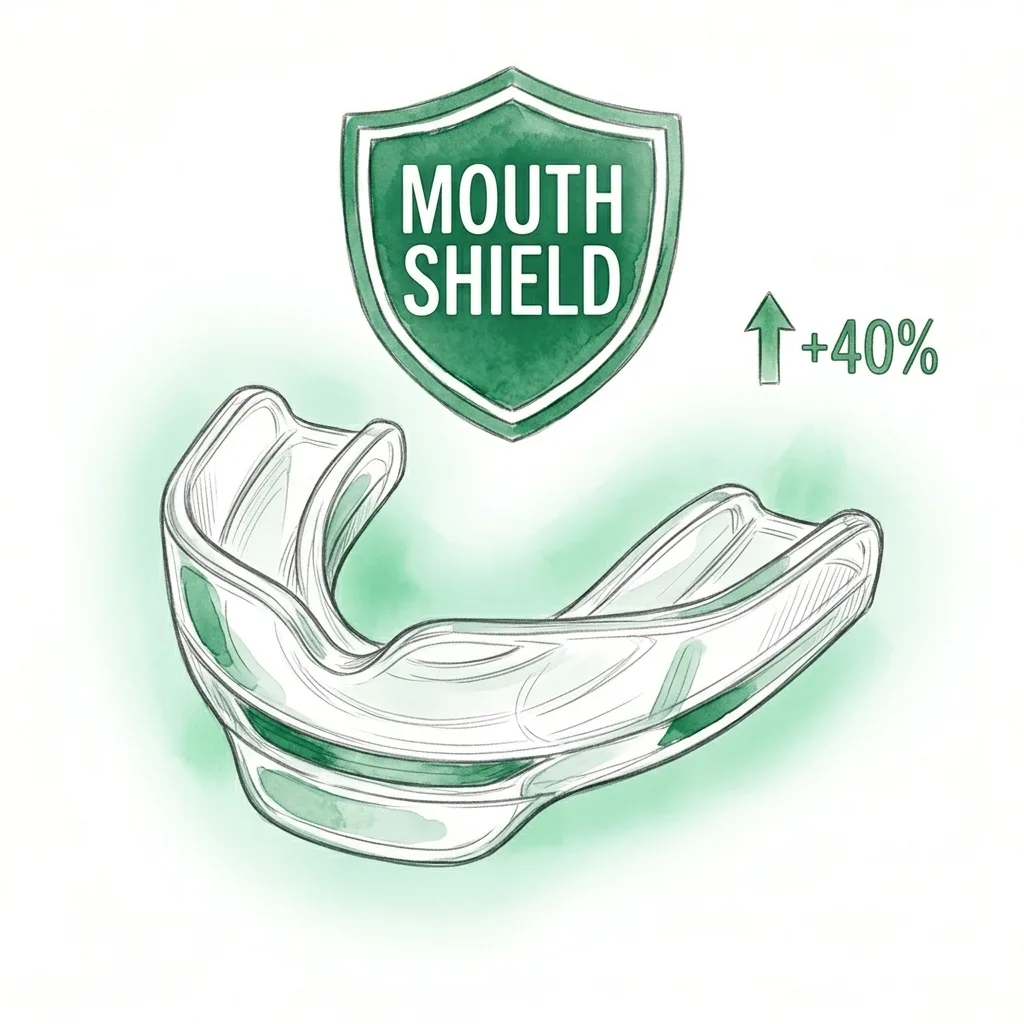
Heatmap analysis and six targeted changes took MouthShield from 4.69% to 6.6% conversion in 17 days.
Read case studyWeekly insights on A/B testing, personalization, and conversion optimization.